What is XCR?
Experienced Color Range (XCR) is a way of quantifying the perceptual brightness of displays. Find out why XCR is important and the benefits of XCR in premium displays.
What is XCR?
Displays are the medium of visual storytelling and understanding the perceptual capabilities of a display tells us how immersive, engaging, and realistic these visual stories will be to viewers. Simple measurements of optical display performance, such as luminance, cannot describe the complex perceptual experience that we have when viewing high definition, high dynamic range content on displays. Even just our perceptual experience of the brightness of a high dynamic range image depends on the entire range of colors in the image, not just the brightness of the peak white.
Experienced Color Range (XCR) is a way of quantifying the perceptual brightness of displays that uniquely includes the effect of color on our perception of brightness. The first step in calculating XCR is to use a color appearance model to convert the measured spectrum of light into perceptual attributes such as achromatic brightness, colorfulness, and hue. For precise definitions of these terms, see RWG Hunt, “Colour Terminology,” Color Res. Appl. (1978). Together, these perceptual attributes can be used to create a 3D color space (Figure 1) where the z-axis is achromatic brightness and the x-y plane is the chromatic plane represented by polar coordinates colorfulness (radius) and hue (angle).
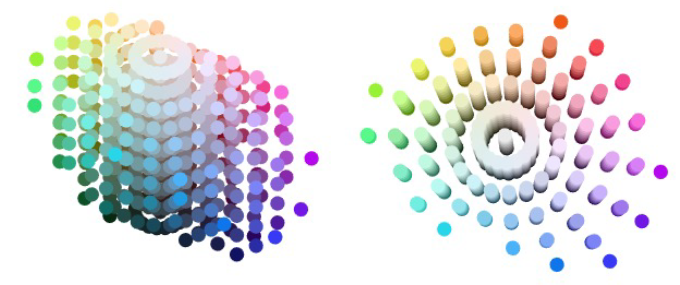
In this 3D color appearance space, XCR is defined as the perceptual distance from black (Figure 2). XCR is calculated from the predicted achromatic brightness, Q, and colorfulness, M, following the formula (where Q0 is the brightness of display black). This equation is derived from the color science term vividness, which was defined as the Euclidean distance from black by color scientist Roy Berns in “Extending CIELAB: Vividness, Depth, and Clarity,” Color Res. Appl. (2013) to better correlate with colloquial language around “brighter” and “duller” colors, citing examples from artists, the dye industry, and other color scientists. (The technical term for XCR is Vividness Perceptual Contrast Length.)

Thus, XCR declares that when we judge the brightness of displayed imagery, we are not simply judging the achromatic brightness, but our entire perception of an image, including its colorfulness. If we just analyzed achromatic brightness or luminance instead of XCR, it would be equivalent to only looking at grayscale images to judge a display, instead of looking at full-color images.
Why do we need XCR?
The convention in the past 100 years of colorimetry has been to solely measure the response of the achromatic visual pathway when discussing brightness and human visual sensitivity. This exclusion of the chromatic visual pathway can be seen in the most common measure of human visual sensitivity: luminance. Luminance was defined using heterochromatic flicker photometry, an experimental method that specifically isolated our achromatic response, suppressing the chromatic visual pathway. This decision ensured that luminance would be additive (the luminance of a stimuli made from two lights is equal to the sum of the luminances of each individual light), but necessitated the tradeoff that chromatic information be excluded. This led luminance to underestimate the brightness of chromatic stimuli: if a gray stimulus and a chromatic stimulus have the same luminance, the chromatic stimulus will appear much brighter. The phenomenon is known as the Helmholtz-Kohlrausch Effect, and it must be considered if we want to accurately predict the perceived brightness of chromatic stimuli.
More information about the additivity of luminance and the various experimental methods for measuring brightness can be found in Lennie, Pokorny, & Smith, “Luminance,” JOSA A, 1993. Barry B. Lee provides an excellent overview of the distinct achromatic and chromatic neural pathways in our visual system in “Visual pathways and psychophysical channels in the primate,” J. Physiol., 2011. A discussion of models of the Helmholtz-Kohlrausch Effect can be found in Hellwig, Stolitzka, & Fairchild, “Extending CIECAM02 and CAM16 for the Helmholtz-Kohlrausch Effect,” Color Res. Appl. (2022).
What is the history of XCR?
Most of us are used to hearing about contrast ratio, which is the ratio between the luminance of white and black on a display. However, OLED displays are capable of producing near perfect blacks, giving them near infinite contrast ratios, which doesn’t really tell us much about their actual contrast. Perceptual Contrast Length (PCL) takes a different approach, calculating the arithmetic difference between the perceived brightness of white and black on a display. The term perceptual refers to the fact that this measure, unlike luminance, is calculated using a perceptual metric of brightness that accounts for the nonlinear relationship between perceived brightness and the amount of light. A study by Shin et al (“A New Approach Toward Visual Clarity Assessment,” SID Digest, 2011) found that Perceptual Contrast Length better predicted subjective ratings of display brightness than luminance contrast ratio.
One significant limitation of the traditional PCL metric, however, is that it only considers peak white and deepest black, excluding the overall color performance of a display. Recently, work has been done to extend PCL to account for the brightness of the more saturated colors that a display can produce. The most recent iteration of this metric is called Vividness PCL or XCR.
What are the benefits of XCR?
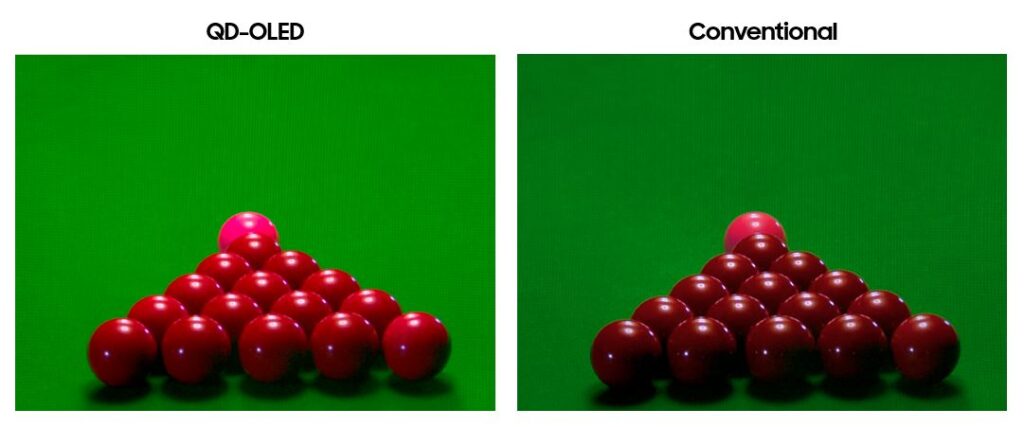
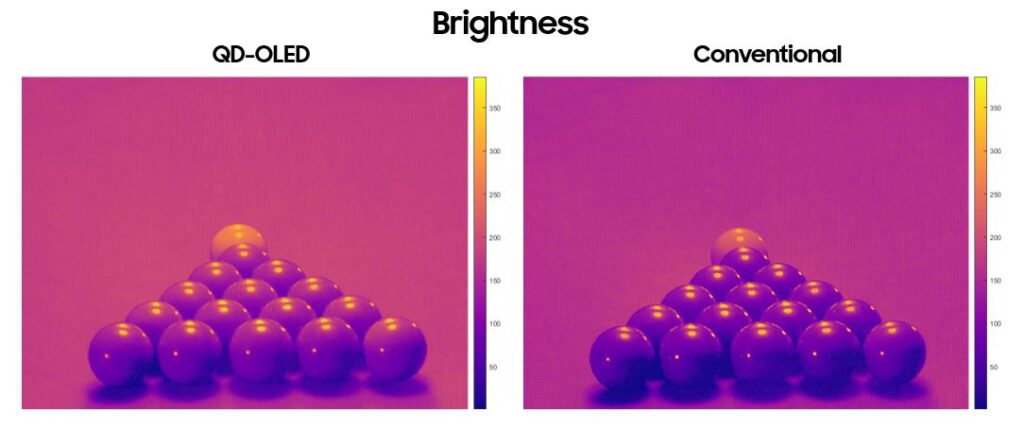
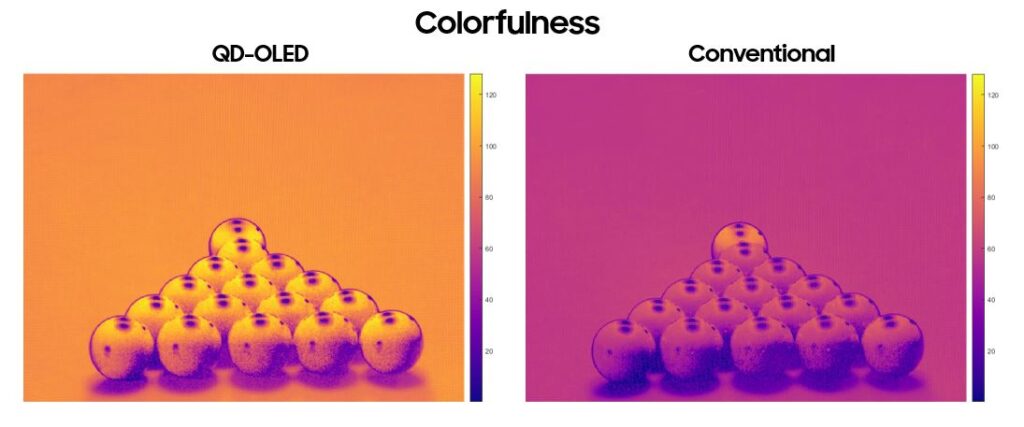
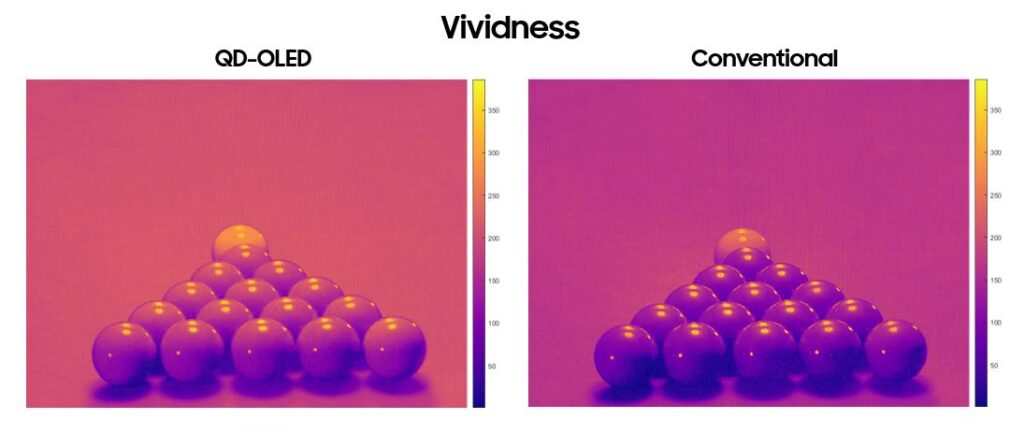
We know that chromatic information feeds into our perception of brightness in a definitive way. Additionally, we know that the brightness of saturated colors is important to consumers. XCR provides a robust metric of display brightness that accounts for these two critical factors and that is rooted in published perceptual science and color science. XCR also correlates nicely with subjective comparisons of display brightness. In one study, we found that XCR was almost twice as accurate as mean luminance in predicting which one of two HDR displays observers would find brighter for a variety of HDR images. One example can be found in Figures 3 to 6. For this image of billiard balls, the QD-OLED and conventional displays were predicted by CIECAM16 to produce similar values of achromatic brightness (Figure 4). However, the image on the QD-OLED is much more colorful (Figure 5), leading to greater values of PCL Vividness (Figure 6). This agrees with our subjective testing, which rated the QD-OLED as brighter for this image.
The XCR metric is the result of Samsung-sponsored research at the Munsell Color Science Lab of the Rochester Institute of Technology. It represents the best attempt so far at properly accounting for the effect of chromatic saturation on consumers’ actual perception of brightness. However, this research continues, with the goal of developing a new empirical model of brightness that can even better predict the results of subjective testing. These new metrics, including XCR, will allow us to tell the full story of the perceptual experience of cutting-edge displays. More information about XCR can be found in Hellwig, Stolitzka, Yi, & Fairchild, “Brightness and Vividness of High Dynamic Range Displayed Imagery,” SID 2022 Digest.

4 thoughts on “What is XCR?”
Comments are closed.